
Parallel hybrid propulsion · twin shaft

Silent on battery.
Charging under diesel.

H1G Drive adds two electric motors to each propeller shaft, next to the existing diesel. Leave harbour and arrive with no noise or exhaust. When the diesel runs, the same motors become generators and refill the battery.

Power per shaft
50 kW
Torque per shaft, cont. / peak
320 / 400 Nm
Shaft speed range
0–2,400 rpm
ELECTRIC · battery → motors DIESEL existing engine OFF RUNNING E1 MASTER E2 SLAVE 2 × 25 kW on one shaft DC bus BATT

Project report, 23 October 2026. It was compiled from the project's source code, the motor-controller firmware and the test logs recorded on the development installation. Every number is marked as Rated, Measured, Derived or Not yet measured. Only measured numbers belong on a spec sheet.

4motor-inverters, two per shaft, all running our control script
50 kWrated power per shaft, continuous and peak (25 kW per inverter)
49 kWelectric drive power held for 2 hours on one shaft, measured
≤ 5 %telemetry error against clamp-meter checks of the currents
Working today

Proven on the test installation

  • Electric drive, diesel drive and generator charging on both shafts
  • One shaft in electric mode while the other charges
  • 36 kW electric drive held for 57 minutes on one shaft
  • Efficiency measured: 98 % DC-to-shaft at 836 rpm and 324 Nm
  • Overspeed fix: smooth return to neutral with no runaway
  • Full monitoring on the chart plotter, with alarms and history
Open

Must be solved before full sea trials

  • Speed runaway during hard acceleration with high generator torque on the other shaft
  • CAN link of the supervisor drops out while the power stage switches
  • At high load the inverters report about 1.9 kW more power than the battery and charger supply, and the cause is not yet known
Missing

Not measured yet

  • Efficiency above 840 rpm (beyond that the map is a model)
  • Thermal run confirming the 50 kW rating and 60 s peak
  • Module weight and added length
  • Range and speed on the water, cost per installed system
Chapter 02

On the test bench

Recorded on 6 October 2026 at the development installation: the motors on their test frame, and the helm software running live on a Simrad NSS evo3S chart plotter. Tap a moment on the right to jump to it.

Chapter 03

On the water

Recorded on 15 October 2026 on the boat at 7.8 knots, on electric drive only with the diesels off. Turn the sound on: what you hear is the wake and the water, not the drive. Tap a moment to jump to it.

Speed7.8 kn
DriveElectric only
DieselsOff
Chapter 04

The system

The motors sit on the propeller shafts alongside the diesel engines, which makes this a parallel hybrid. A modular LFP battery, one master pack plus slave packs, feeds a common DC bus. A supervisory computer links every device over CAN and drives the display on the boat's chart plotter.

Electric

Quiet manoeuvring and cruising

The motors drive the shaft from the battery. The diesel stays off. The helm lever controls speed directly, with smooth ramps in both directions.

Diesel + generator

Range and recharge

The diesel drives the boat. The motors switch to generator mode automatically once the shaft has turned steadily for 2 seconds, and charge the battery with up to 400 Nm per shaft.

Mixed

Each shaft independent

Port can run electric while starboard charges under diesel. Every shaft decides its own mode, and the helm shows both at a glance.

Drive

Four motor-inverters, two per shaft, 25 kW each. 50 kW per shaft, continuous and peak. Peak torque (400 Nm per shaft) for 60 seconds to accelerate, then automatic fallback to 320 Nm continuous.

Battery

Modular LFP packs, 57.6 V and 18.1 kWh each: one master plus slaves in parallel, built and certified by TAB Mežica. REC 10M battery management running our own application, adapted to this hybrid drive.

Helm and fleet

Runs on the boat's existing Simrad chart plotter. A supervisory computer logs every value and syncs to shore for remote monitoring and alarms.

Battery packs

The battery is modular. One master pack is always fitted, and slave packs are added in parallel to reach the energy the boat needs. Every pack is a sealed unit with its own cells, battery management, precharge, contactors, fuse and current measurement. Packs are built and certified by TAB Mežica. The test installation has been ordered with one master and four slave packs.
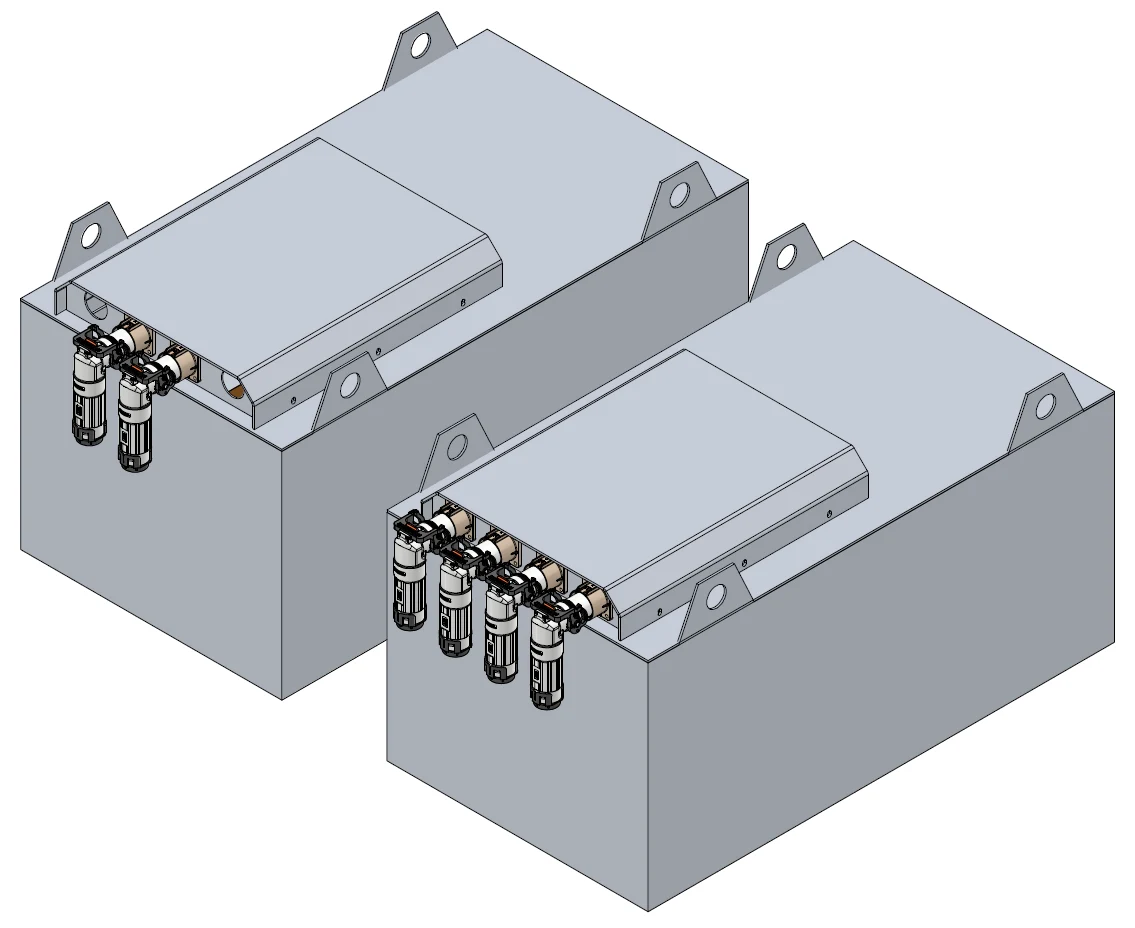
Two battery packs: grey steel boxes with lifting eyes, a raised connector cover on top and power connectors on the end face
Two packs of the revised design, 715 × 400 × 395 mm each, with lifting eyes and the connector cover on top. Render: TAB Mežica, September 2026.
18.1 kWhper pack, 18 × 314 Ah × 3.2 V
57.6 Vnominal, 18 LFP cells in series
314 Aper pack, continuous charge and discharge (1C); 800 A peak for 5 s
~130 kgper pack (±5 %), 715 × 400 × 395 mm
1 + 4master + slave packs in the test order
90.4 kWhnominal energy of the test order
1,570 Acontinuous at 1C, about 90 kW at 57.6 V
~650 kgfive packs together
Cells18 × LFP prismatic, 314 Ah, two modules of 9 in series. Cells certified to UN38.3 and UL.
EnclosureIP65, with lifting eyes and an LED state-of-charge display
Battery managementREC 10M running our own application. The master wakes the slave packs through a wired signal. When the master is switched off, no pack draws any current.
SwitchingREC precharge unit and two 48 V main contactors (TE Kilovac EV200) per pack
ProtectionMain fuse and current shunt in every pack, sized to the cells' 1C limit
Power connectors2 × positive and 2 × negative Amphenol PowerLok per pack
Signal connectorsM12: CAN (A-coded), RS-485 (B-coded), 12-pole relay and remote on/off, 8-pole master–slave link (in, out, termination)
Sleep and lockA pack sleeps when its lowest cell nears the minimum voltage. It can only be restarted by a deliberate unlock command over CAN.
Energy density, per pack139 Wh/kg · 160 Wh/L

What the BMS controls

Relay 1Enables or disables the solar MPPT charger, based on the highest cell voltage
Relay 2Charge enable to the Victron Quattro. The BMS also sets charge voltage and current over CAN.
Relay 3Additional common precharge on the master, when needed
Relay 4Confirms that the pack is connected
Button inputAcknowledges an error and silences the buzzer until a new error or a master reset
CANBMS limits and settings can be read and changed over CAN, and errors are broadcast every 1.4 s. The supervisor already uses the settings channel for the parameter console on the helm.

Motors

Each shaft carries one Boeli DDHPS300 SPS30 permanent-magnet synchronous motor, built from two independent 25 kW units on the same shaft. Each unit has its own EMSISO inverter, so a shaft has a master and a slave drive that share the load. The motor sits in the shaft line through a bellhousing, next to the diesel.
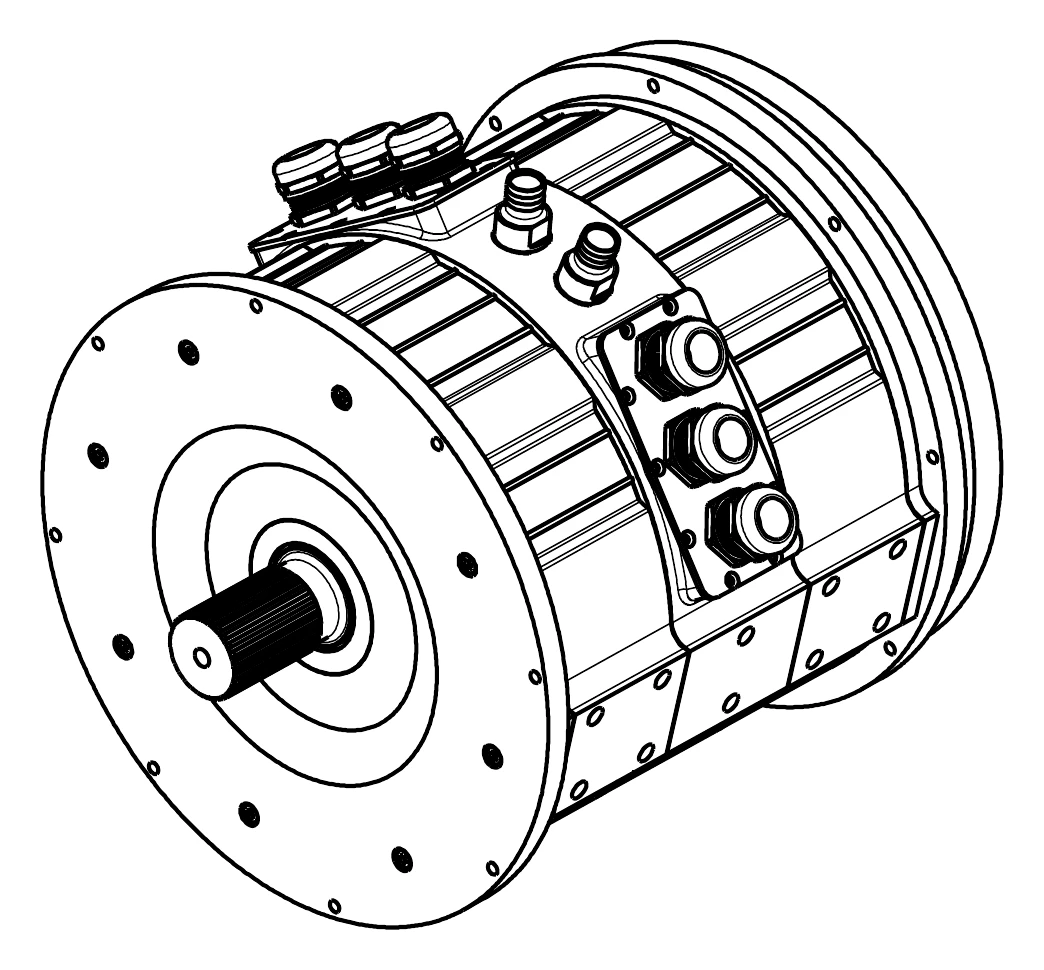
Line drawing of the motor: a cylindrical ribbed housing with a large front flange, a splined output shaft, cable glands and two coolant fittings on top, and a connector panel on the side
Boeli SPS30 2×50 DDHPS: Ø 355 mm, 434 mm long including the output shaft. Drawing: Boeli, April 2025.
2 × 25 kWper shaft, two stator sets on one shaft
2 × 160 Nmcontinuous torque at 100 °C, 320 Nm per shaft
93 %motor efficiency at 1,500 rpm (manufacturer)
24 poles12 pole pairs, permanent-magnet rotor
TypeBoeli DDHPS300, version SPS30 2 × 25 kW. Two motors on the boat, one per shaft.
DimensionsHousing Ø 355 mm. Overall length 434 mm, of which 70 mm is the output shaft.
Output shaftSplined, DIN 5480, module 1.5, 30 teeth, 64 mm engagement length
MountingFront: 8 × M8 on Ø 341 mm. Rear: 4 × M20 on Ø 280 mm, 4 dowel holes Ø 10 H7 on Ø 220 mm.
Voltage33.3 V at 1,500 rpm; 52.5 V line-to-line at 2,550 rpm (20 °C)
Current760 A RMS per stator set, 800 A phase current per stator set
Motor constantsMagnet flux linkage Ψpm 8.56 mWb · Ke 0.136 V·s/rad (line-to-line RMS), 0.111 V·s/rad (phase peak)
Rotor positionRLS absolute ring encoder, Ø 114 mm (read head DHR114, ring SAR114). Resolver alternative: TE V23401U7018B709.
ConstructionLiquid-cooled housing (see below), rolling bearings at both ends, radial shaft seals, bellhousing to the shaft line, sealed cable cover with M32 glands, lifting eyes
InvertersEMSISO, one per stator set, four on the boat, running our own control script

Cooling all the way round

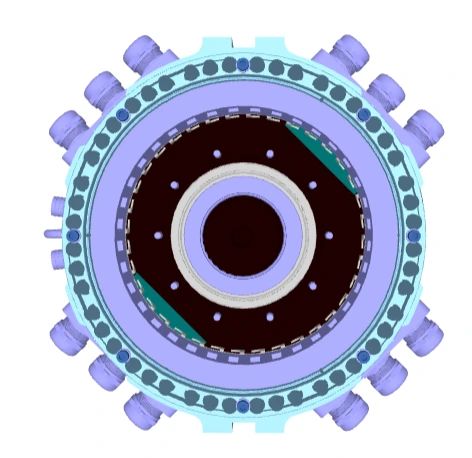
End-on section of the motor: a ring of round coolant channels in the housing wall, all the way round the stator
Section through the motor. The ring of holes in the housing wall is the coolant path.

The housing wall around the stator carries a ring of axial channels, evenly spaced over the full circumference. Water-glycol flows through all of them, so the coolant surrounds the stator on every side and takes heat straight from the windings and the iron.

Because there is no cold side and no hot side, the stator stays at an even temperature. This is what lets each unit deliver 160 Nm continuously (rated at 100 °C), inside a closed housing in the engine room.

The motors sit on the boat's internal coolant loop. The PDM starts the pumps at key-on, and a heat exchanger passes the heat to sea water.

Architecture of the development installationTeal = our own software or firmware
coupled on test rig Port diesel engine existing engine · not ours OFFRUNNING Starboard diesel engine existing engine · not ours OFFRUNNING key-on supply → inverters + PDM CAN 250 kbit/s · CANopen · NMEA 2000 main contactor close cmd DC bus · 52.5–62.2 V Port mastermotor-inverternode 21 Port slavemotor-inverternode 20 Stbd mastermotor-inverternode 11 Stbd slavemotor-inverternode 10 discharging charging Battery · 18S LFP REC 10M BMS Victron Quattro inverter / charger shore power in PDM Blowersventilation Ext. pumpsea water Heat exchangercoolant ↔ sea Int. pumpcoolant loop HELM Key switch Throttlelevers ×2 SimradNSS evo3Sour dashboard Supervisorserver · loggingalarms · cloud Wi-Fi

DC powerKey-on supply and contactor commandCAN dataPDM outputsCoolant (dashed: sea water)Mechanical shaft

Node numbers are the CANopen IDs the shared Lua script uses to tell the four controllers apart at runtime. On the test installation, the two shafts are mechanically coupled, so one shaft can drive the other. That is why the logs show combinations such as "port electric while starboard generates".

What is ours and what is bought in

ComponentSourceOur contribution
Motors ×2Boeli DDHPS300 SPS30 · 2 × 25 kW stator sets eachSpecification for this drive
Inverters ×4EMSISO (supplier) · 25 kW eachControl script, 1,150 lines of Lua: state machine, generator torque law, derating, protections
Supervisory serverOwn6,086 lines of Python: CAN decoding, WebSocket server, logging, alarms, cloud sync, bench tools
Helm dashboardOwn15 canvas modules for the Simrad NSS evo3S: main, battery, cells, engines, history, CAN diagnostics, calibration
Battery packTAB Mežica (assembly and certification)Specification for this drive
BMSREC 10M (hardware)Our own BMS application, adapted to this hybrid drive; per-cell monitoring and parameter console on the helm
Inverter/charger, solarVictron (supplier)Read over NMEA 2000, mode control
Power distributionPDM (supplier)Read and displayed
DisplaySimrad NSS evo3S (supplier)Hosts our HTML5 app
Fleet back end and mobile appOwn (in progress)Remote sync, push alarms, AI troubleshooting chat

Total own code in the boat repository: about 17,800 lines. This table shows what was written. Who legally owns it is a separate question, answered in chapter 10.

Ratings and operating envelope

Power is limited to 50 kW per shaft (25 kW per inverter), both continuous and peak. Below that, torque is the limit. Peak torque is allowed for 60 seconds to accelerate, then the drive falls back to continuous torque by itself.

Power per shaft, continuous = peak50 kW
Power per inverter25 kW
Continuous torque, per motor / shaft160 / 320 Nm
Peak torque, per motor / shaft200 / 400 Nm
Peak duration, then automatic fallback60 s
50 kW reached at, continuous / peak torque1,492 / 1,194 rpm
Power per shaft vs shaft speed
Continuous (rated)Peak, 60 s (rated)Measured · driveMeasured · generator

Curves: Rated values. Dots: Measured shaft power (torque × speed) per shaft, 15-second steady samples from the 1 and 5 October tests (249 samples, 162–840 rpm). The rating itself has not yet been confirmed by a thermal endurance run.

Chapter 05

Live dashboard, on simulated data

This is the real helm software that runs on the boat's chart plotter. Here it is fed by a scripted voyage instead of the CAN bus, so you can try it without the boat. Message formats and value ranges are copied from a live recording on 6 October 2026.

Simulated data
Change the phaseUse the buttons above the screen: docked charging, electric cruise, diesel with generator, and mixed modes. The voyage also cycles through them on its own.
Tap the screensTap the battery for cell detail and a gauge for that engine's page. Every metric there opens a history chart.
Trigger a fault"Stbd slave silent" shows how the supervisor flags an inverter that stops reporting.
Simulated data

Mobile app

The same boat in the owner's pocket. The app reads the boat over the fleet server from anywhere with a connection. Here it runs on the same simulated voyage as the helm screen above.

  • It opens on the boat: battery, inverter, both shafts and the energy flow at a glance. The back arrow leads to the fleet list.
  • Tap a card, then any value with a chart icon, for its history over 5 minutes to 24 hours. Drag on the chart to zoom.
  • Tap the inverter to switch it on, off or to charge-only. The command is queued and confirmed by the boat.
  • Alarms come in as push notifications, with a troubleshooting assistant for each one.
Chapter 06

Voyage simulation

Choose a voyage profile and adjust the assumptions. The model uses the firmware's real limits (generator torque law, voltage derating, 2,400 rpm cap) on top of a simple propeller load curve. Play the voyage to watch the instruments.

MODELThese results are calculated, not measured. The hull load and battery capacity are assumptions until a target boat is fixed. Use this to see how the system behaves, not as spec-sheet data.
Rated · 18.1 kWh per pack; default = test order of 5 packs
User setting
Assumption · per shaft, cube law
User setting
Rated 320 Nm continuous, 400 Nm for 60 s
Model from Oct tests ≈ 86 % at rated point
Port shaft
Stbd shaft
Battery power
State of charge
0:00
Electrical power per shaft and at the battery (kW)
PortStarboardBattery

Sign convention, the same as on the helm: negative means the shaft draws from the battery (electric drive) and positive means it charges (generator). The model limits each shaft to its 50 kW rating and generator torque to the 320 Nm continuous rating.

Shaft speed (rpm)
PortStbd
Battery state of charge (%)
Chapter 07

Control & protection

All four inverters run the same control script. It reads the throttle and the battery over CAN, decides the operating state and protects the battery, the motors and the diesel. The values below are the settings in the current firmware file, so they describe the design, not test results.

State machine

Precharge→Off / Neutral→Drive (velocity mode)orGenerator (torque mode)→Shutdown·Error·No data

Generator mode starts only after the shaft has stayed above 110 rpm with the lever in neutral for 2 continuous seconds. That means the diesel is turning the shaft. This dwell was added on 10 Sep 2026 after electric coast-down was mistaken for a running diesel.

Derating curves from the firmware

Generator torque command vs shaft speed (per motor, nominal 200 Nm)

Torque ramps in from 60 to 80 rpm, then stays at nominal up to 2,420 rpm. Above 2,480 rpm the diesel-overspeed shutdown trips. Torque changes are rate-limited to 100 Nm/s, and a return to neutral ramps speed down at 200 rpm/s.

Key settings

Drive speed command range0–2,400 rpm
Generator torque, max per motor200 Nm
Battery operating window52.5–62.2 V
Drive cut-off latchfactor ≤ 0.05
Motor / inverter / HCU temp limit150 / 95 / 95 °C
Battery temp limit, drive / charge53 / 43 °C
Throttle message timeout250 ms
Precharge timeout6,000 ms
Diesel overspeed shutdown2,480 rpm
Status broadcast interval100 ms
Chapter 08

Evidence ledger

Each result below states how it was obtained. Rated numbers are the design ratings of the drive. Measured numbers come from instrument readings on the development installation. Derived numbers are calculated from measurements. Items not yet measured have no number and stay off the spec sheet.

Efficiency from the October tests

On the test rig both shafts are coupled, so one shaft can drive the other. The driving shaft turns battery power into shaft power and the other shaft turns it back into electricity. Efficiency follows from the inverter DC power and the shaft power (torque × speed) on each side. The torque readings pass a cross-check: both sides of the same shaft agree within 1.5 %, and the difference is friction.

WindowSpeedTorque / shaftDrive: DC in → shaftEff. driveGenerator: shaft → DC outEff. gen
5 Oct · 11:31–11:35836 rpm324 Nm36.2 → 28.3 kW78 %27.9 → 21.1 kW76 %
5 Oct · 11:26–11:28729 rpm333 Nm33.7 → 25.5 kW76 %25.1 → 18.0 kW72 %
5 Oct · 11:16–11:20480 rpm342 Nm25.4 → 17.2 kW68 %17.1 → 9.9 kW58 %
1 Oct · 10:51–10:55456 rpm46–150 Nm2.6 → 2.2 … 9.1 → 7.2 kW76–86 %——
5 Oct · 13:13–13:14297 rpm399 Nm22.5 → 12.4 kW55 %12.4 → 2.6 kW21 %

Losses stay at about 8 kW per shaft at 320–340 Nm whatever the speed, and grow with torque. That is the signature of copper (I²R) losses. Shaft power rises with speed while these losses do not, so efficiency rises with speed at the same torque. A two-term loss model fitted to 142 steady drive samples from 1 and 5 October (error ±0.26 kW, 34–399 Nm, 162–840 rpm) gives:

Drive efficiency per shaft, DC to shaft (%)
Model, fitted to measurementsMeasured · driveMeasured · generator

Loss per shaft ≈ 6.81·10⁻⁵ × T² + 0.88·10⁻³ × rpm (kW, T in Nm). Measured range 162–840 rpm at 34–399 Nm. Beyond 840 rpm the curve is Derived: about 86 % at the rated point (320 Nm, 1,492 rpm, 50 kW). Iron losses grow faster than linearly at high speed, so the model may be optimistic there. A dyno run should confirm it.

Chapter 09

Open issues and risks

These are the known problems, with the evidence for each and the next step. Each one would stop a customer installation as things stand.

SeverityIssueEvidenceNext step
HighSpeed runaway during hard acceleration
With high generator torque on the other shaft, shaft speed runs away to the 2,400 rpm cap and trips the overspeed protection.
Reproduced twice (10 Sep) at about 17 kW combined. Three software changes did not fix it. Lowering the other shaft's generator torque brings speed back. Steady operation is unaffected (36 kW drive held for 5 minutes on 5 Oct).Raise it with EMSISO as a control-loop question. It is likely specific to the coupled test rig, where speed control on one shaft fights torque control on the other.
HighSupervisor CAN drop-out while the power stage is onSince wiring work on 6 Oct, the supervisor receives and sends nothing for as long as the motors are energised. The inverters then trip on throttle timeout after 250 ms. Electric drive worked until 5 Oct.Hardware: check CAN ground reference, transceiver isolation, termination and shielding.
MediumInverter and battery readings differ by ~1.9 kWOn 5 Oct (11:31–11:35) the inverters' net DC power was 15.1 kW and the BMS showed 10.6 kW. The shore charger supplied 2.6 kW of that gap (Victron, 2.9 kW AC in), leaving about 1.9 kW. On 10 Sep a similar 1.7 kW gap was seen. Both ends matched a clamp meter at low current.Clamp-meter check at high current with shore power off, then trace every path on the DC bus.
MediumGenerator power reads above the physical limitIn 70 of 189 generator samples, the reported DC power exceeds what 400 Nm can produce at the logged speed.Check against the BMS current and a clamp meter at high generator power. Ask EMSISO how DC power is computed in generator mode.
LowSeptember torque data not usableIt implied 117 % / 138 % efficiency. The October data is consistent, so the issue looks fixed in the meantime.Confirm with a torque sensor during the dyno run.
LowSmall jerk at the end of a ramp-downVelocity control on one shaft fights torque control on the other on the coupled rig.Retest on separate shafts in the real boat.
LowCross-shaft power coordinatorWritten, running in log-only (dry-run) mode.Review the logs, then enable.
Chapter 10

Business-plan answers

These are the six questions from the business-plan request. Each one shows what the project record can already answer and what still needs a decision or input from the founders.

Who exactly is the first customer?

Founder input
From the record
  • Development happens on a twin-shaft diesel installation with two motors per shaft.
  • The firmware and dashboard are built for a twin-shaft layout with a chart-plotter helm.
Needed
  • Builder and model
  • Length overall, displacement (t), installed diesel power
  • Signed letter of intent or pilot agreement, if one exists

Continuous vs peak kW, efficiency map, weight and added length

Partly
Answer
  • 50 kW per shaft, continuous and peak (25 kW per inverter). Torque is the limit below that: 320 Nm continuous and 400 Nm peak per shaft.
  • Peak torque for 60 s to accelerate, then automatic fallback to continuous
  • Measured: 50 kW drive held for 2 h on one shaft (1,492 rpm)
  • Efficiency measured DC-to-shaft: 78 % at 836 rpm, 76 % at 729 rpm, 68 % at 480 rpm (all at ~330 Nm). Generator 76 % / 72 % / 58 %.
  • At low torque: 76–86 % at 456 rpm (1 Oct)
  • Loss model from these tests: about 86 % at the rated point. That figure is extrapolated, not measured (chapter 08).
Needed
  • Thermal run at 50 kW to confirm the rating and the 60 s peak
  • Efficiency above 840 rpm and at part load (dyno or higher-speed test)
  • Weighed module and installation drawing

Which battery, BMS and inverter hardware, and which parts are own IP?

Mostly answered
From the record
  • 2 × Boeli DDHPS300 SPS30 motors (2 × 25 kW stator sets each), driven by 4 × EMSISO inverters running our own control script
  • Modular battery by TAB Mežica: packs of 18 × 314 Ah LFP cells, 57.6 V and 18.1 kWh each; test order 1 master + 4 slaves = 90.4 kWh
  • REC 10M BMS running our own application, adapted to this hybrid drive
  • Victron Quattro inverter/charger, PDM, Simrad NSS evo3S
  • Own: control firmware, supervisory server, helm UI, fleet back end (chapter 04)
Needed
  • Exact EMSISO inverter part numbers
  • Quattro model / power rating

Cost price and selling price at 50, 250 and 1,000 units, against a 10 kW kit plus a generator

Founder input
From the record
  • No bill of materials, supplier quotes or labour hours are on record.
  • The model in chapter 11 is ready to take these inputs.
Needed
  • BOM with supplier quotes at each volume
  • Installation hours per boat
  • Price of a reference 10 kW electric kit and generator

What is proven today? Measured vs calculated

Answered
From the record
  • The evidence ledger (chapter 08) separates every number into measured, derived and not yet measured.
  • Apart from the 15 Oct sea test (7.8 kn on electric drive, chapter 03), all measurements come from a test installation.
Needed
  • Confirmation that the installation counts as a bench, or a description of the vessel it is in

Who owns the IP, and who is on the team full-time?

Partly
Answer
  • Full-time team: Rok Pušavec and Miha Dolinar
  • In-house work: inverter control firmware, supervisory server, helm dashboard, BMS application, fleet back end (chapter 04)
Needed
  • The legal entity that owns the code and firmware, and any agreements with the boat builder, EMSISO, REC or TAB Mežica
  • Roles of the two team members
Chapter 11

Cost model

Enter the bill of materials and labour at one reference volume. The model applies a learning curve to estimate cost at 50, 250 and 1,000 units a year, then compares the result with the price of a 10 kW electric kit plus a generator.

Example numbers only. These are not project data.
Units / yearCost priceSelling pricevs 10 kW kit + generator

Learning curve: cost × (rate)log₂(volume / 50), applied to both hardware and labour. Selling price = cost ÷ (1 − margin). The model holds no project figures until they are entered.

Chapter 12

Path to a spec sheet

These steps turn the "not yet measured" items into measured numbers, in order of dependency.

Fix the CAN drop-outGrounding and isolation of the supervisor's CAN interface. Nothing can be logged at load until this is done.
Resolve the acceleration runaway with EMSISOShare the reproduction and logs. Agree on the control mode for coupled shafts.
Close the DC power balanceRepeat the back-to-back test with shore power off and a clamp meter at high current, so that battery-side and motor-side power agree before the efficiency figures go on the spec sheet.
Complete the efficiency map and thermal runExtend the 5 Oct back-to-back test to 2,400 rpm and to part load, then a 60-minute run at 50 kW with repeated 60 s peaks. This confirms the rating and replaces the model above 840 rpm.
Weigh and measure the moduleMass, added shaft-line length and installation drawing.
Sea trial on the first-customer boatSpeed–power curve, electric range, charge rate under way, noise. The voyage model in chapter 06 then gets a measured hull curve.